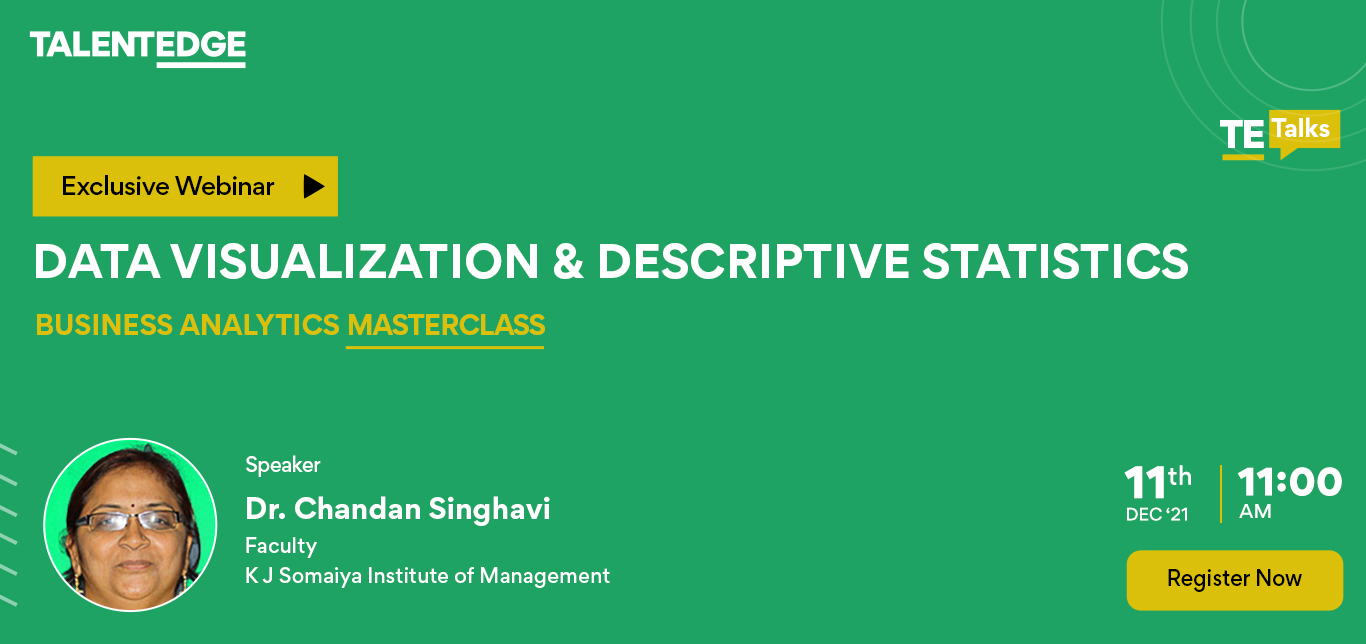
Data Visualization & Descriptive Statistics
Business Analytics Webinar
The ability to create smart data visualizations was once a nice-to-have skill. But in today’s world where the amount of data is overwhelming, creating and communicating through compelling data visualizations is a must-have skill for all. Learn how to create powerful data visualizations that will improve the impact of your presentations through the most important processes, activities, and best practices for creating effective data visualizations and successful visualization.
Business Analytics Skills you will learn
- How to create powerful data visualizations.
- Various graphs, charts and basic statistical techniques including data properties.


